Most people meet the Boston Consulting Group (BCG) Matrix in a classroom, learn its four quadrants in an afternoon, and assume they understand it. The grid itself is simple: it sorts a company’s products or business units by how fast their market is growing and how strong their position is within it. What is not simple is what happens in the boardroom when the grid says something a leader does not want to hear. This guide explains how the matrix works, how to build one properly, where its logic breaks down, and the psychology that quietly decides whether anyone acts on it.
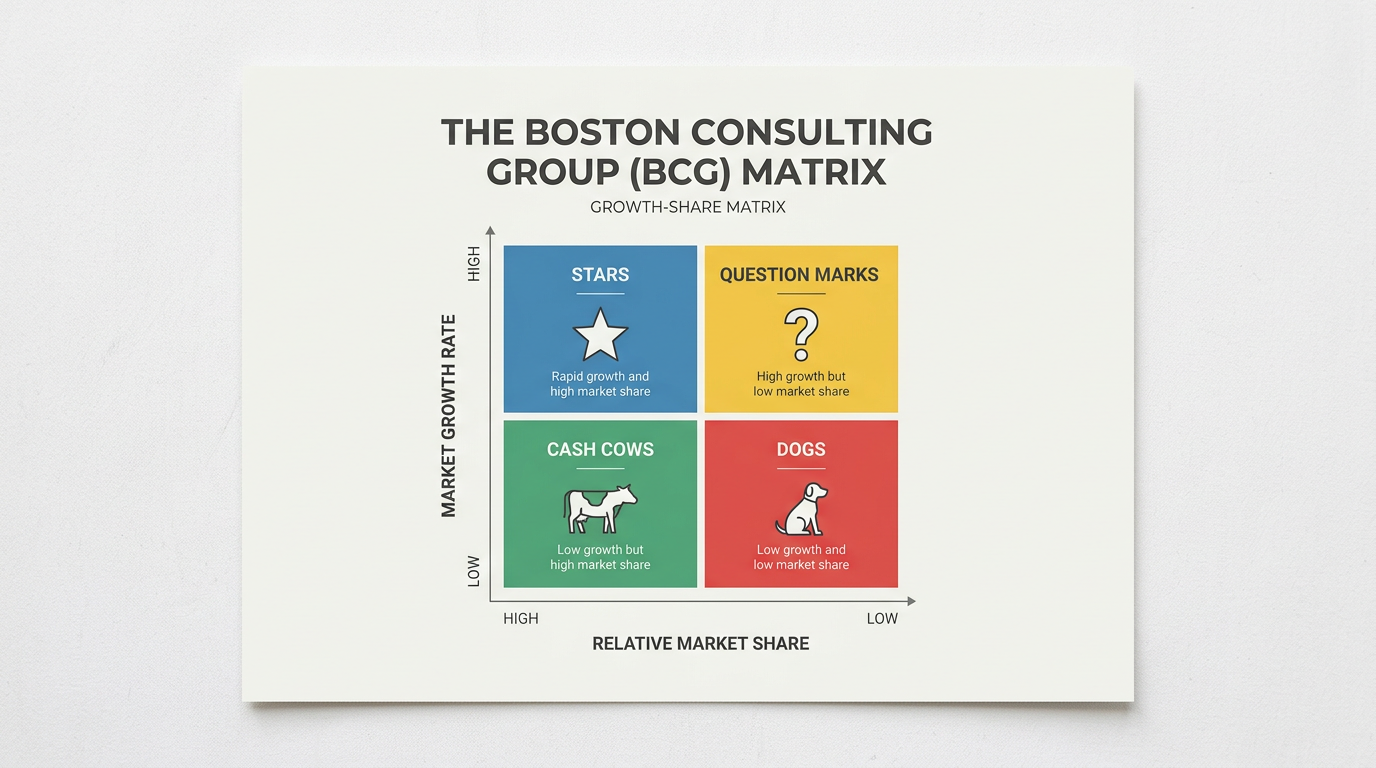
In short, the Boston Consulting Group (BCG) Matrix, also known as the growth-share matrix or the Boston Box, is a two-by-two portfolio tool. The vertical axis shows the market growth rate. The horizontal axis shows relative market share, which means your share of the market compared with that of your largest competitor.
The result is four categories:
- Stars: high growth and high share.
- Cash Cows: low growth and high share.
- Question Marks: high growth and low share.
- Dogs: low growth and low share.
Each category comes with a default move: invest, harvest, test or exit. The matrix was designed around cash. Its purpose was to move money from the businesses that generate it to the businesses that need it.
Where the BCG Matrix Came From
The grid was a team effort inside the firm. Alan Zakon, who later became BCG‘s chief executive, drew the first version and refined it with colleagues, and founder Bruce Henderson brought it to a wide audience through his 1970 essay “The Product Portfolio”.
Its logic rested on the experience curve. This is the observation that unit costs tend to fall as cumulative production rises, so the biggest producer can become the cheapest. High relative share was taken as the source of lasting superior returns, because the leader built a cost advantage through scale and experience that rivals struggled to copy, while fast-growing markets were where that leadership was easiest to win.
Henderson put the underlying principle bluntly: “Every company needs products that generate cash.”
The idea spread quickly. At its peak in the late 1970s and early 1980s, estimates suggest roughly half of Fortune 500 companies used the matrix or a method derived from it, and Harvard Business Review later listed it among the frameworks that changed the world.
The Four Quadrants Explained
Stars lead in growing markets. They earn a lot of cash but also consume a lot to keep pace with growth. The default move is to invest and defend. Handled well, a star becomes the next cash cow once its market matures.
Cash Cows lead in mature, slow-growing markets. They need little reinvestment and produce steady surplus cash. The default move is to harvest efficiently and use that surplus to fund the future.
Question Marks sit in fast-growing markets where the company is still small. They are hungry for cash and uncertain. The default move is to decide: back the ones with a credible route to leadership and stop the rest.
Dogs hold weak positions in slow markets. The traditional advice is to divest, reposition or run them for whatever value remains. Interestingly, BCG’s own label for this quadrant was “pets”, commonly illustrated with a dog. That detail will matter later.

How to Build a BCG Matrix in Five Steps
- Define the unit and its market. This is the step most people rush, and it decides everything that follows. Draw the market too broadly and every product looks small. Draw it too narrowly and every product looks like a leader.
- Measure market growth. Use the annual growth rate of the market, not of your own sales. Many textbook versions draw the dividing line at around 10%. A more honest benchmark is the average growth of your wider industry or economy.
- Calculate relative market share. Divide your market share by the share of your largest competitor. If you are the leader, divide by the next largest. A result above 1.0 means you lead.
- Plot each unit. Place each unit on the grid and size its circle by revenue, so the picture shows both position and weight.
- Decide, then diarise a review. A matrix without a decision is decoration. The discipline here is the same one behind confident decision-making: name the choice, the evidence and the date you will revisit it.
A worked example (hypothetical). Imagine a mid-sized packaged-foods company in Mumbai with four product lines:
| Product line | Market growth | Company share | Largest rival’s share | Relative share | Quadrant |
|---|---|---|---|---|---|
| Millet snack bars | 18% | 4% | 12% | 0.33 | Question Mark |
| Ready-to-cook curry pastes | 14% | 20% | 10% | 2.0 | Star |
| Traditional pickles | 3% | 30% | 15% | 2.0 | Cash Cow |
| Plain papad | 1% | 5% | 25% | 0.2 | Dog |
On paper, the plan writes itself:
- Harvest the pickles.
- Invest in the pastes.
- Test the snack bars quickly.
- Exit the papad.
Now add one fact the spreadsheet does not hold. The papad is made from the founder’s mother’s recipe, and it was the first product the company ever sold. You can already feel the plan getting heavier.
Where the BCG Matrix Falls Short
The matrix has well-known limitations.
- Market share no longer reliably predicts performance. BCG says this itself: its own researchers found that share has stopped being a dependable predictor of sustained performance, and that new sources of advantage, such as the capacity to adapt to or shape change, now matter as well.
- Businesses move between quadrants faster than they used to. In most industries studied, the average time a company spent in one quadrant roughly halved, from about four years in 1992 to under two years in 2012.
- It measures units in isolation. A “dog” may exist because it keeps a key distributor loyal or feeds a star, which is why a systems thinking lens should sit beside any portfolio grid.
- It ignores profitability directly. Share and growth are proxies, not profit.
The most striking evidence concerns decision quality. In a set of experiments spanning 1,015 participants across six countries, knowing about the BCG matrix made people more likely to pick an investment that was clearly less profitable, and 64% of those exposed to it made the unprofitable choice. Among those who actively applied the matrix in their analysis, the figure rose to 87%.
I read this less as an indictment of the grid and more as a warning about what labels do to thinking. Once a unit is called a “star”, the word begins doing the analysis for you.
The Psychology the Matrix Does Not Show
The grid assumes a rational allocator of cash. Real portfolios are run by people, and people carry history.
The first force is the sunk cost effect: the tendency to keep going with something because of what has already been spent on it. Arkes and Blumer showed that people who had already invested in a project rated its chances of success higher than people judging the identical project without that prior investment. In other words, past spending does not only keep us committed. It changes what we believe about the future.
Organisational researchers call the wider pattern escalation of commitment: pouring further resources into a failing course of action to justify earlier decisions. It is not a character flaw peculiar to stubborn executives. Sensitivity to sunk costs has been observed in rats, mice and humans alike. That suggests we are dealing with old wiring, not poor intelligence.
Then there is identity. This is where I want to name a pattern that repeatedly derails portfolio reviews. I call it the named dog: a low-growth, low-share business that survives every review because it carries someone’s identity, history or pride. The founder’s first product. The division a chairman built as a young manager. The service line that “made our name”.
A named dog is rarely defended with numbers. It is defended with stories. Here is a composite example, drawn from a pattern common in family and founder-led businesses. A leadership team agrees in principle that a legacy line should close. The decision is minuted, and then it is quietly deferred for three consecutive years, each time for a different, perfectly reasonable operational reason. The real reason never appears in the minutes. Closing it would feel like closing a chapter of the founder’s life.
In NLP terms, the label acts as a frame that tells everyone how to feel before they think. It works in the other direction too. Teams inside a “cash cow” often sense that they are being milked rather than developed, and the best people tend to leave first. The label shapes behaviour long before the strategy does.
This is often the real work in executive coaching. The analysis is usually the easy part. The work is helping a capable leader separate what a business means to them from what it does for the organisation.
The matrix can tell you where your money should go. It cannot tell you where your identity has already gone.
BCG Matrix 2.0: Using It in a Faster World
BCG has updated its own guidance. The firm now argues the matrix should be applied faster and treated as a tool for strategic experimentation. That means:
- Reviewing the portfolio more often.
- Generating more question marks and testing them cheaply.
- Milking cows through streamlining and incremental improvement.
- Keeping “pets” on a short leash while mining their failures for lessons about where to experiment next.
I would add one column the original grid never had: who owns the story? For each unit, name the person whose identity is tied to it. You are not doing this to overrule them. You are doing it so the emotional stake is spoken aloud rather than smuggled into the decision.
Then rebuild the case from first principles: if you were starting today, with no history, would you fund this?
For founders especially, this conversation is often easier with someone outside the building. That is a large part of what entrepreneur mentoring is for.
A Private Portfolio Review
Before your next strategy meeting, sit with these questions:
- Which part of your portfolio would you defend with a story rather than a number?
- What are you still funding because stopping would mean admitting something about the person who started it?
- If a capable stranger inherited your business tomorrow, what would they close by Friday?

The Grid Is Only Half the Decision
Henderson built a tool for moving cash. The leaders who use it well have learnt something harder: how to move their attachments too. A portfolio stays healthy not because its owner is ruthless, but because its owner can grieve a good thing that has run its course and still fund what comes next.
If you are facing a portfolio decision that feels heavier than the numbers suggest, a free 15-minute consultation is a quiet place to begin.


